Financial Capital

FY2026 marked a defining year in our financial journey. Against the backdrop of India’s expanding infrastructure investment and growing global demand for complex, technology-driven construction, we recorded our highest-ever order booking, activated multiple cost-efficiency levers, and made deliberate progress in reshaping our revenue mix towards higher-margin, future-ready sectors. These outcomes reflect disciplined execution of our financial strategy and lay the foundation for sustained and profitable growth.
Navigating Challenges with
Fiscal Discipline
Key Highlights of FY2026
-
₹22,000+ Cr
Order Booking - Highest-ever in TPL history
-
₹16,126 Cr
Revenue from Operations (Standalone)
-
0.66%
EBITDA Margin
Key Focus Areas
- Order Book Quality and Conversion
- Working Capital and Cash Conversion
- Margin Management
- Capital Allocation and Balance Sheet Strategy
- Tax Governance and Compliance
Alignment with UN SDGs



Revenue Mix and Strategic Sector Exposure
We continue to steadily reshape our revenue portfolio towards high-growth, value-accretive sectors aligned with India’s infrastructure expansion and rising global investment flows. This balanced approach supports sustainable long-term growth while ensuring legacy sector exposures are managed prudently.
Based on the FY2026 order-booking mix, we are prioritising opportunities across data centres and advanced technology facilities, thermal power and clean energy, luxury real estate and urban infrastructure, airports and sustainable aviation fuel (SAF), and the Tata Group capex cycle — segments that offer scale, execution complexity, stronger margin potential, long-term demand visibility, and strategic relevance in a rapidly evolving infrastructure landscape.
Order Book Quality and Conversion
FY2026 was a landmark year for our order book — not only in terms of scale, but also in terms of quality, diversity, and strategic relevance of the projects we secured. Our ability to compete and win across complex, high-growth sectors reflects the depth of our execution capabilities, the trust of our clients, and the strength of the relationships we continue to build over time.
Segment-Wise Order Wins
India’s digital and AI-led transformation is accelerating the need for world-class infrastructure built for scale, reliability and sustainability. Through Mission 2030, with an ambition to achieve 10 GW capacity, we are playing a pivotal role in enabling this national transformation by delivering critical, high-performance infrastructure for hyperscalers, co-locators and the rapidly expanding data centre ecosystem.
As India advances towards large-scale data centre expansion, our engineering-led expertise enables the delivery of technologically advanced facilities with precision, efficiency and a strong focus on sustainability. This aligns closely with the country’s vision of building a resilient digital backbone to support long-term economic and technological progress. Beyond constructing infrastructure, we are contributing to strengthening India’s position as a global digital and technology hub.
Our FY2026 order wins remained well diversified across sectors, reflecting the breadth of our execution capabilities, strong market presence and ability to address complex infrastructure requirements across industries. During the year, we also secured orders from key strategic accounts, including Adani and Torrent, across multiple business segments, reinforcing long-standing client confidence, repeat business strength and the trust placed in our execution capabilities.
-
Thermal Power and Clean Energy
Large-scale thermal power and energy transition projects with NTPC, Torrent, and Adani
-
Luxury Real Estate and Urban Infrastructure
Premium residential and mixed-use developments with Mahindra, Godrej, Adani, Elan, and Experion
-
Data Centres (Advanced Technology)
Landmark wins — largest global hyperscaler’s first data centre in India, positioning TPL as a credible player in the high-complexity tech infrastructure space
-
Airports, MRO & SAF
Airport projects with Adani and Air India; exclusive Sustainable Aviation Fuel (SAF) project positioning in India and Bahrain




Geographic Distribution of Orders
Our order wins are geographically diversified across India’s major economic corridors, reducing concentration risk and reinforcing our pan-India delivery capability.
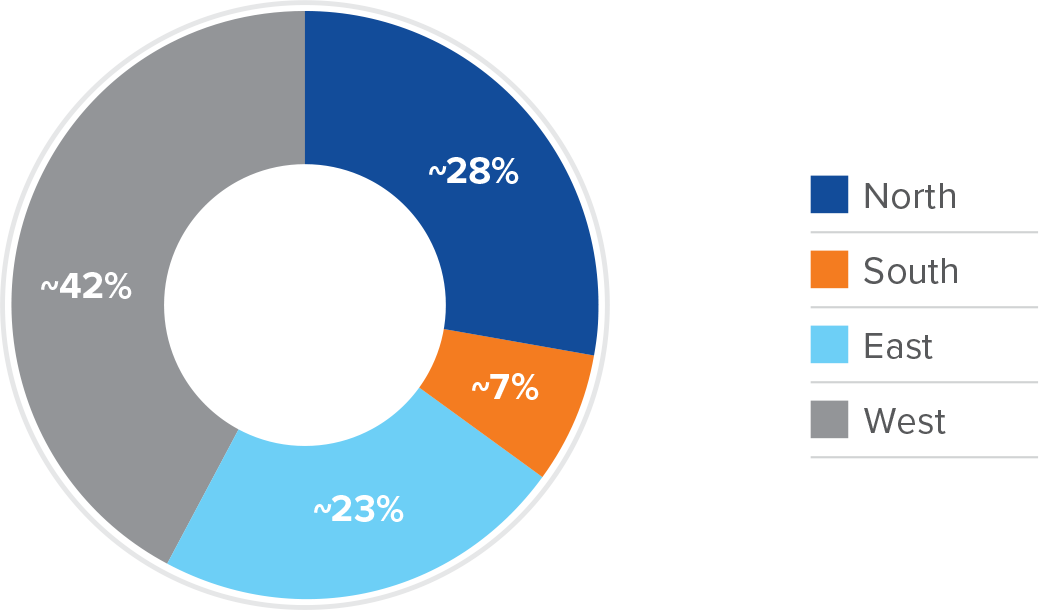
- North, about 28 percent
- South, about 7 percent
- East, about 23 percent
- West, about 42 percent
Working Capital and Cash Conversion
Maintaining disciplined working capital management is central to our financial resilience, particularly given the scale of projects underway and the long billing cycles inherent in the EPC business.
In FY2026, we intensified our focus on cash conversion through a combination of digitally enabled financial controls, real-time project monitoring, and systematic receivables and vendor management:
- The Project Monitoring KPI Dashboard provides real-time comparison of physical progress against actual customer billing, helping identify completed work that is pending invoicing
- A Project-wise Receipt and Payment Report within SAP offers a consolidated view of vendor payments, customer receipts, and treasury transactions, enabling timely identification of delayed or early payments
- The Vendor Reconciliation Report enhances the visibility into outstanding liabilities and has been adopted across key projects and finance teams
- The live VIM–CLM integrated SAP solution enables system-driven vendor invoice processing aligned with contract terms, while improving GST reconciliation and process efficiency
Margin Management
Our margin improvement strategy is driven by two parallel priorities: a deliberate portfolio shift towards higher-margin, complex sectors, and systematic execution-level cost savings at the project level. In FY2026, we activated multiple levers at once to drive profitability improvement, building on the challenging FY2025 EBITDA of ₹89.50 Crore (0.55% margin) and targeting a meaningful recovery, with FY2026 EBITDA standing at ₹106 Crore (0.66% margin). Complementing these efforts, our structured innovation ecosystem continued to generate measurable financial returns, reinforcing our belief that innovation is a quantifiable source of value, not merely a strategic aspiration.
Key Margin Improvement Levers:
- SCM Strategic MoU - Rebar Supply: Strategic agreements with Tata Steel and JSW Steel delivered ₹6.11 Crore in cost savings through sharp market insights and agile negotiations.
- Alternate Equipment Dashboard: A real-time redeployment intelligence tool identified up to ₹20 Crore in annual savings by substituting hired equipment with underutilised internal assets at the mid-cycle stage.
- F&S Asset Refurbishment Facility, Ghaziabad: A dedicated 1,400 MT per annum facility extended equipment life by three years, generating an estimated annual capex savings of approximately ₹9 Crore.
- CTP11 Electrical Excellence: Permanent electrical connections replaced diesel generator sets, generating approximately ₹1 Crore in recurring annual savings.
- Business Excellence Practitioners Programme: Fifteen structured improvement projects were identified in January 2026 through cross-functional benchmarking and collaboration.
Capital Allocation and Balance Sheet Strategy
Our approach to capital allocation is guided by clear financial principles: preserving balance sheet strength commensurate with the scale and risk profile of the business, pursuing growth selectively in sectors with strong return characteristics, and ensuring our borrowing profile remains disciplined and cost-efficient. These principles are applied across major project bids, capital expenditure decisions, and investment choices.
Tax Governance and Compliance
Tata Projects is committed to full compliance with all applicable tax laws and regulations, ensuring timely, accurate, and responsible reporting to relevant authorities. This approach reflects our belief that responsible tax practices are an important contribution to society and help build long-term stakeholder trust. We conduct all tax matters professionally, fairly, and with integrity, in line with the Tata Code of Conduct, and maintain a strict zero-tolerance stance towards tax evasion. The Company also fosters transparent and constructive relationships with government and tax authorities, supported by appropriate disclosures in its financial statements.
Direct Economic Value Generated and Distributed*
| Financial Metrics (₹ Cr) | FY2026 | FY2025 | FY2024 |
|---|---|---|---|
| Economic Value Generated | |||
| Turnover | 16,126 | 16,363 | 17,247 |
| Other Income | 193 | 124 | 349 |
| Total Economic Value Generated | 16,319 | 16,487 | 17,596 |
| Economic Value Distributed | |||
| Operating Costs | 15,163 | 15,288 | 15,738 |
| Employee Benefits | 1,329 | 1,383 | 1,145 |
| Payments to Providers of Capital | 845 | 781 | 573 |
| Payments to Government | - | - | - |
| CSR Spend | 0 | 1.02 | 5 |
| Total Economic Value Distributed | 17,337 | 17,453 | 17,460 |
| Economic Value Retained / (Lost) | (1,018) | (966.64) | 136 |
| Benefits Provided to Employees | |||
| Salaries and Wages | 1,188 | 1,217 | 1,004 |
| Benefits Provided to Employees | 82 | 101 | 102 |
| Staff Welfare | 59 | 66 | 38 |
| Total Benefits Provided to Employees | 1,329 | 1,383 | 1,145 |
| Cost Incurred on Well-being Measures as a % of Total Revenue of the Company | 0.8% | 1% | 1% |
*Standalone