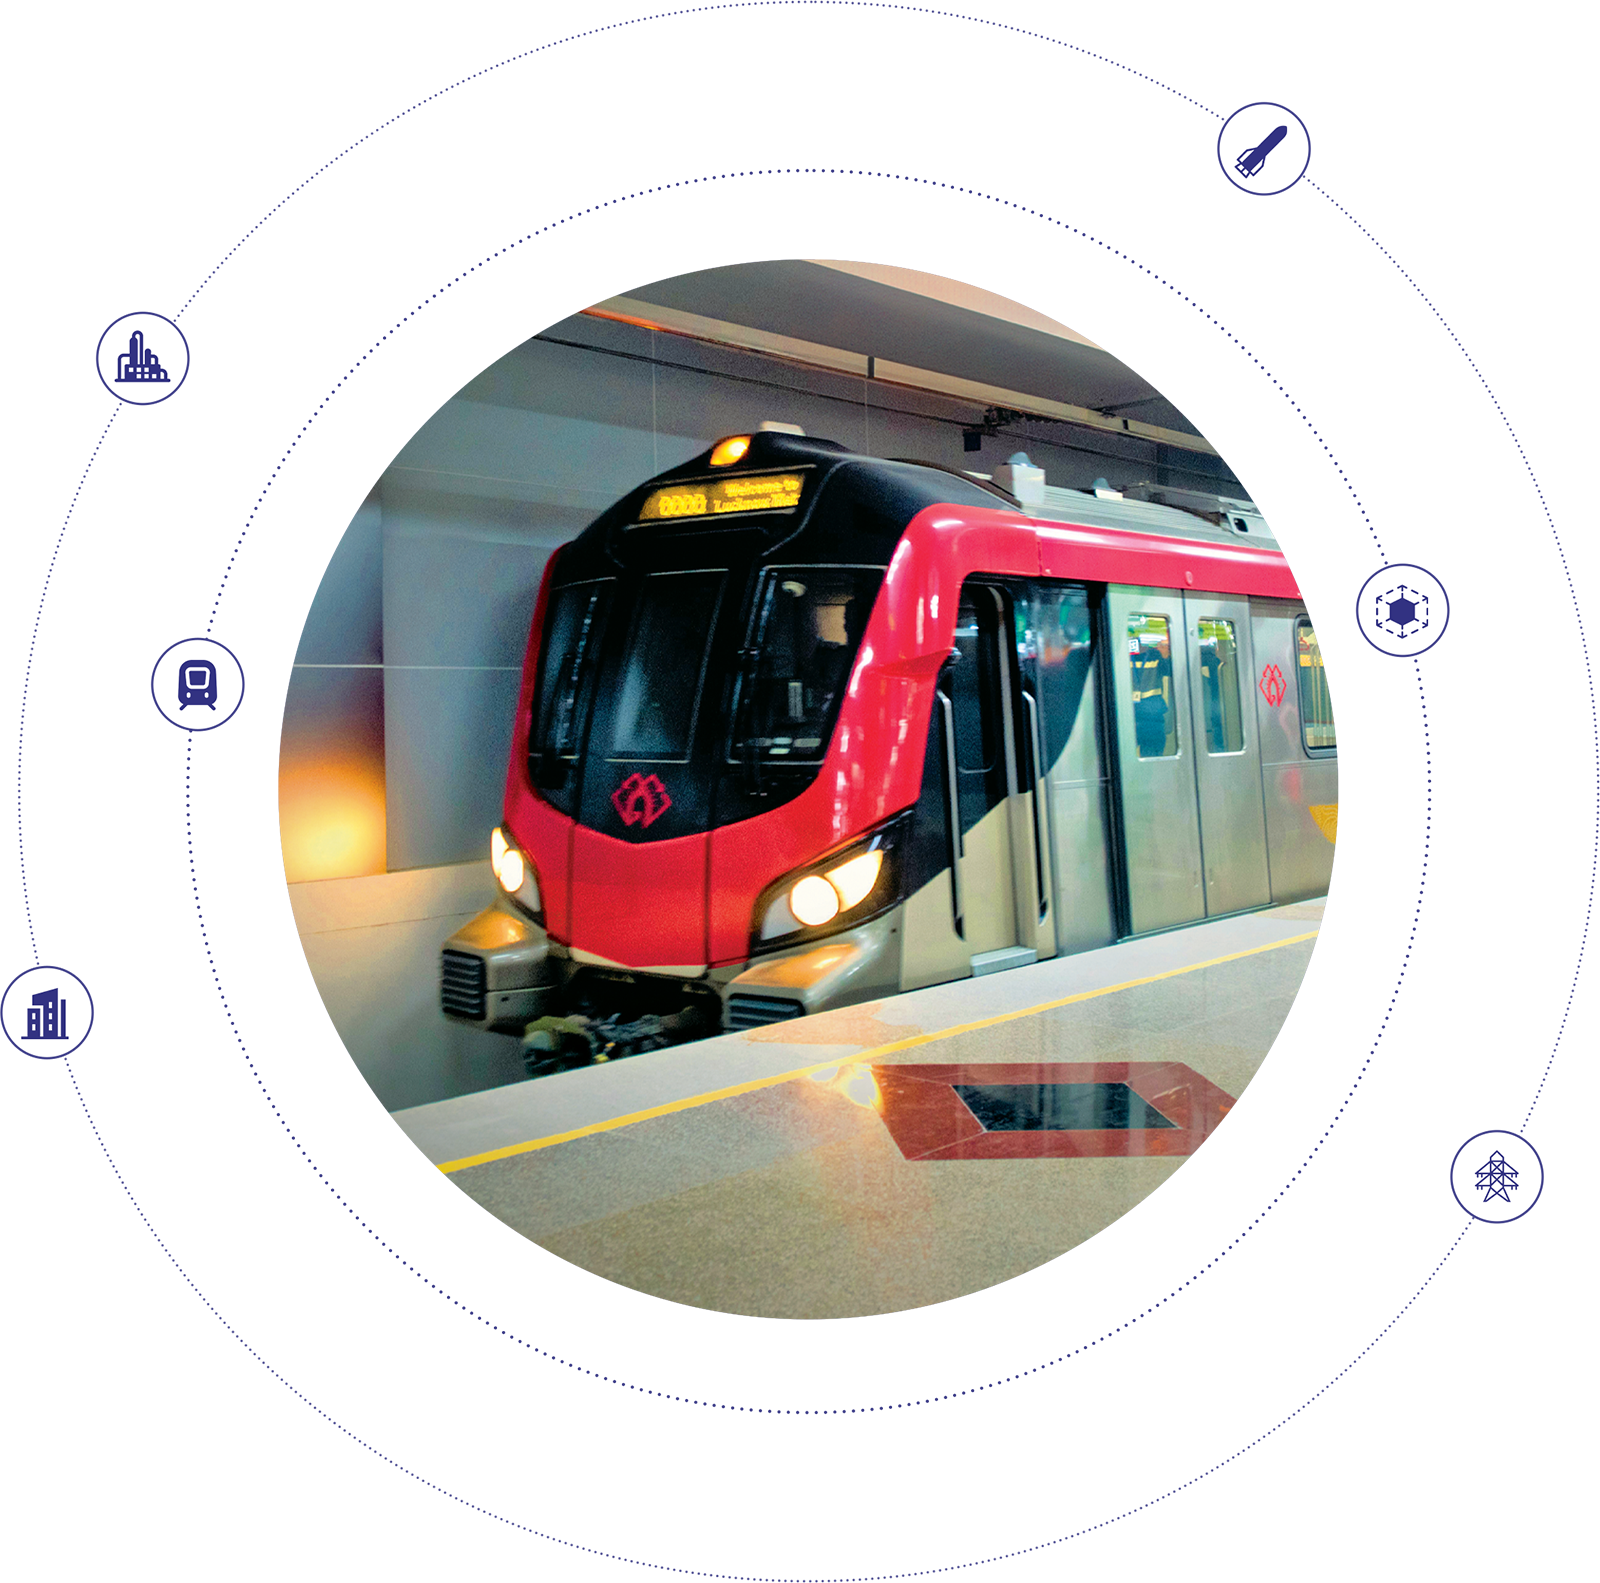
At the heart of our business strategy lies the commitment to create and deliver sustained value for all stakeholders. We strive to enhance value across all relevant capitals of our business, ensuring that each stakeholder derives meaningful benefits from our initiatives.
EPC projects delivered through various contractual modalities including LSTK, Item Rate, Cost-Plus, Open Book, GMP arrangements
FY2024 | FY2023 | |
Current Assets (` in Cr) | 18,770 | 18,360 |
Standalone Order Backlog (` in Cr) | 36,000+ | 40,000+ |
Net Worth (` in Cr) | 2,893 | 2,801 |
Net Block of Assets (` in Cr) | 782 | 759 |
Borrowings (` in Cr) | 5,101 | 3,369 |
Galvanising Capacity (in KTA) | 48 | - |
Tower Manufacturing Capacity (in KTA) | 36 | - |
Structural Steel Fabrication Facility (in KTA) | 12 | - |
No. of On-roll Employees | 6,347
(total number of employees) 5,012 (participated in training) |
5,768
(total number of employees) 3,737 (participated in training) |
Investment in Training
and Development (` in Cr) |
2.47 | 1.90 |
No. of Workhours of Training | 1,71,867
(27 hours per employee) |
1,12,165 |
Total CSR Spend (` in Cr) | 5 | 6 |
No. of Suppliers (in Nos.) | 68,030 | 61,789 |
No. of MSME Suppliers (in Nos.) | 9,604 | 4,194 |
Total Investment on Digital initiatives in project management (` in Cr) | 2.5 | - |
Total Investment for Digital
Transformation (SAP HXM, NEEV) (` in Cr) |
~100 | - |
New Technology Tie-ups | 11 | - |
Renewable Energy Generated (in GJ) | 4,255 | 5,068 |
Saplings Planted (in Nos.) | 63,233 | 36,183 |
Water Consumption (in KL) | 30,80,854 | 42,47,603 |
FY2024 | FY2023 | |
Profit After Tax (` in Cr) | 139 | (867) |
Operating Cash Flow (` in Cr) | (1,448) | (1,413) |
Construction Projects Completed (till date) | 200+ | - |
Material Supplied (till date) (in MT) | 4,00,000+ | - |
Towers Supplied (till date) (in MT) | ~4,00,000 | - |
Employees with Tenure of Over 10 Years (%) | 12 | 15 |
No. of Whistle Blower Complaints Resolved | 88 | 60 |
Lost Time Injury Frequency Rate (LTIFR) (Hours / Million) |
0.122 | 0.126 |
No. of Beneficiaries | 26,465 | 34,764 |
New Technologies |
|
|
Innovative products launched | 46 | - |
Carbon Emissions Reduced (tCO2e) | 934 | 1,112 |
Grid Energy Replaced (in GJ) | 4,255 | 5,068 |
Discharged Water Reused and Recycled (In KL) |
3,48,284 | 2,46,945 |
Water Saved (in KL) | 86,477 | 67,662 |
Engineering
Procurement
Construction
Project Management
Fabrication
Assurance
O & M